
 5. Dr. Fergus Connolly: The 5 I’s of Information Management.

- Instant – understand the immediacy of information. Next week is probably too late
- Integrated – you must be able to correlate information and easily compare one set with the other.
- Important – Make sure data is simple, clean, understandable.
- Individual – Make sure the information is individual, even in team sports different players have different playing standard, key performance indicators and learning styles. Adapt your approach.
- Intuitive – How easy can you make your data to understand. Make data for the masses not for the geeks.
 6. Manchester City: Our Past, Present and Future approach to Analytics.

This was a great presentation. Man City used 4 presenters – which they were quick to joke about from the start. Before I get into the actual content of the presentation a quick thought on how it was presented. They were one of the few presenters who really but huge effort into how they presented their information. They used a tool called Prezi but beyond that they used loads of images and video. This is much better than wordy PowerPoint presentations where attendees are always reading ahead of your speaking. Speaking to people afterwards they remarked how slick the presentation was and I think people underestimate what an important part the delivery plays alongside the actual content.
The four presenters were; Simon Wilson (Strategic Performance Manager), Edward Sulley Performance Analysis Team), Gavin Fleig (Head of Performance Analysis), David Fallows (Scouting & Recruitment Co-Ordinator).
 Now for the content – this too gets top marks. The presentation started with a bit of a journey back in time. A sort of ‘This is Your Life’ of performance analysis! This was a great look back and most of the analysts chuckled to themselves as they remembered what it was like in the ‘old days’ of the Swap Shop. What was most interesting is we forget that the ‘old days’ were probably only 2004/2005. For example it wasn’t until that season that teams were able to get as much footage as they liked. Until that time they relied on swapping VHS tapes and recording highlights programmes which contained about 28 mins of footage. Hard to believe and for me really highlights how we are still at the early stage of all this.
They also made some great points about analysts being much more than number cruncher’s. Analysts must have good personal skills to mix with coaches and players, be creative and have excellent presentation skills in either delivering or preparing a presentation.
Gavin Fleig – Head of Analysis
The presenters changed throughout, and up next was Gavin Fleig the head of analysis at City. He spoke about the importance of conducting
- correct analysis,
- delivering it effectively and then
- confirming the learning.
He also spoke about something interesting – Inspiring the players!! This caused some debate in the bar afterwards when I was chatting to a few other analysts, that perhaps as analysts we underestimate the power of belief?
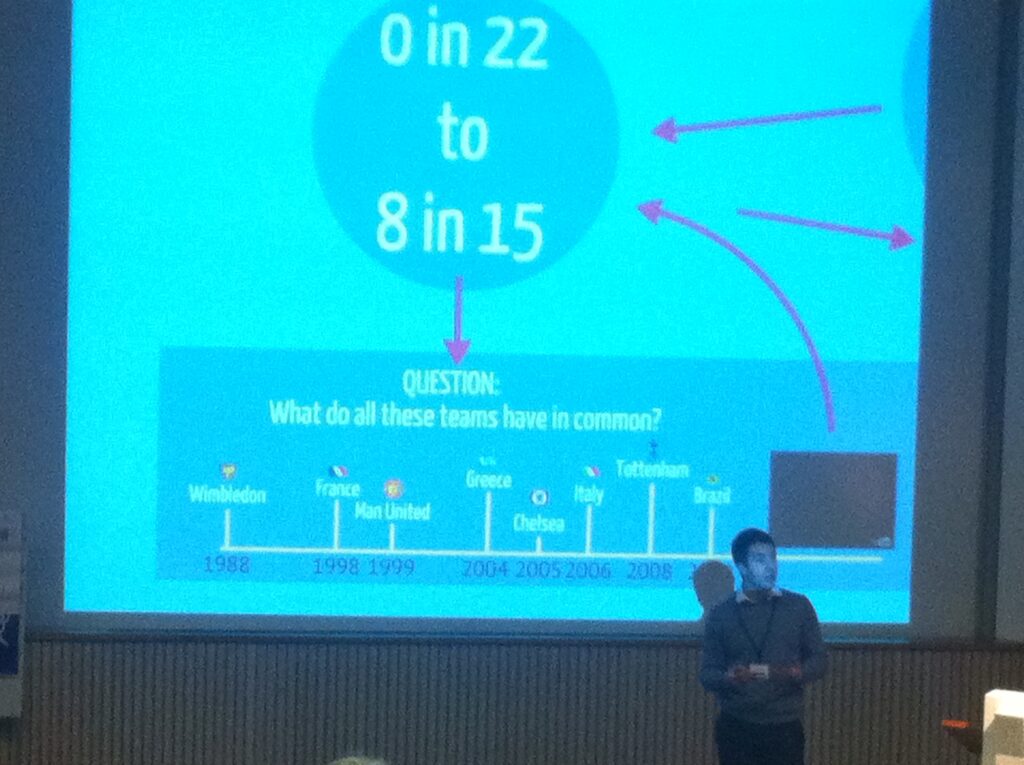
 Gavin gave a fantastic practical application of analysis, he showed a sort of historical time line, which listed team names (some country and some club). He then asked what have these teams got in common – there was silence. He then stated that all these teams had one major championships with a goal scored from a corner. They then showed a video of the 8/10 goals. Man City used this with their players. City had gone 22 games and not scored a goal from a corner. After this….. they scored 8 goals in 15 games. For me this was such a powerful use of analysis. Yes they had the data but they didn’t walk into a room full of players and put up figures of 0/22 or the number of championships that had been one with a corner. Instead they used imagery first and foremost backed up by numbers;
0/22 – Correct Analysis
Video and Images – Effective Delivery
8/15 – Confirm learning


This presentation was the most practical and gave a fantastic insight to what analysis looks like at a Premier League Club. There were loads of little nuggets of information to pick up – unfortunately faster than my pen could go at times. One lasting image of their talk will be how in a small way analysis has gone from Statto (Fantasy Football) to Brad Pitt.
It’s a great image change for the industry – now as analyst can we step up to the mark?
7. And Finally….
I will leave you with the man himself – Billy Beane. This is a longer version of the video played at the opening of the conference. Enjoy. (link)