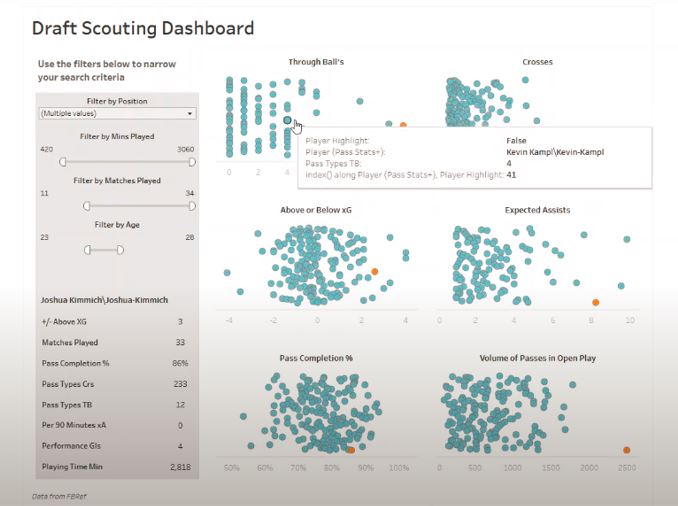
Collecting XY Data
I often get asked about how to collect XY data of your own. Here are a couple of open source tools to help you.
I often get asked about how to collect XY data of your own. Here are a couple of open source tools to help you.
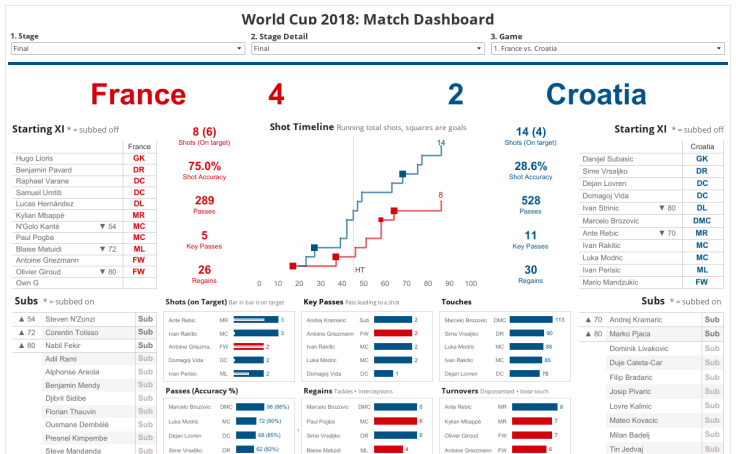
This video explorers how to create an event timeline. This case we plot expected goals across a single match.
This video details how to create pitch zones on top of a pitch background using Tableau. You can download my workbook on Tableau Public here… How…


This video builds on the previous video about zones on a pitch. Here we explore this Tableau drawing tool; https://iamdavehart.github.io/tableau-drawing-tool/# Created by Dave Hart.This tool…
You often need to merge or join additional datasets before you can analyse your data. This video shows you some simple ways to do this…
Big thanks to Ninad Barbadikar for his tutorial which you can find here. This is the calculation that makes it possible; IF INDEX()%2=0 THEN INDEX()-1…

Over the last few months there have been a host of video’s posted online that should be of interest to people here. You may have…
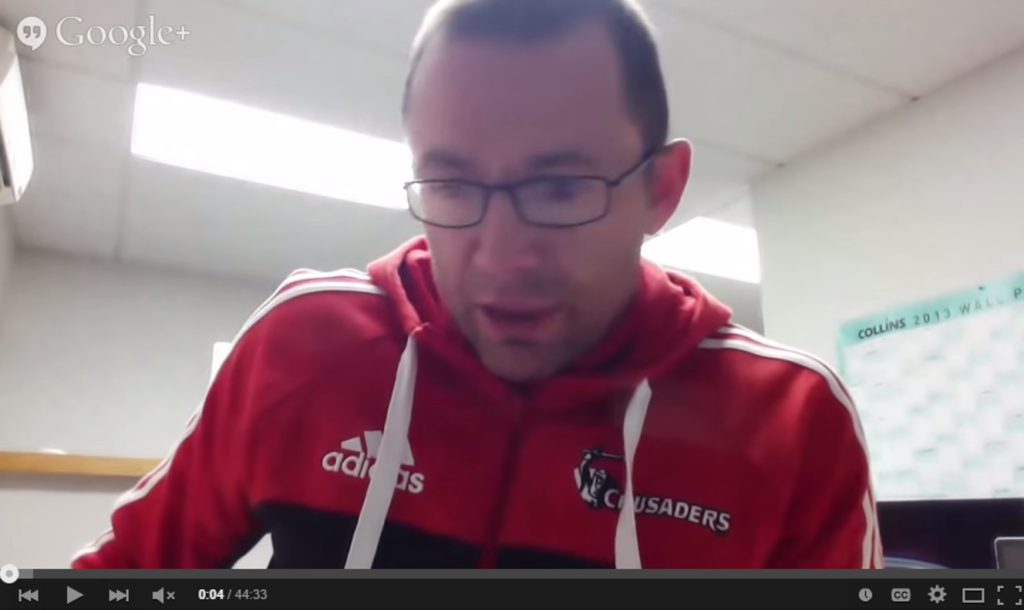
Jamie Hamilton – Performance Analyst Canterbury Crusaders Super 15 rugby will join me for the 3rd Webinar in our Series. You can check out Webinar…
Please confirm you want to block this member.
You will no longer be able to:
Please note: This action will also remove this member from your connections and send a report to the site admin. Please allow a few minutes for this process to complete.
